Temperature Blanket – Flat knit
Temperature is recorded since 1850 and can be traced back to thousands of years by analysing ice and soil cores. The records prove that temperature has been noticeably going up since industrialisation. According to scientific research an average rise of more than 1ºC has been reached. Temperature increase is causing droughts and heavier rainfall that leads to flooding. Each extra degree can add up to 15% more rain.
The diagrams shown are based on the prediction models until 2100, as presented by IPCC (Intergovernmental Panel on Climate Change). Each dataset is based on four emission models, RCP (Representative Concentration Pathways) 2.6, 4.0, 6.5 and 8.5. These range from the least emission, according to Paris Climate Agreement until the maximum emission without any decrease of Greenhouse Gas emission.
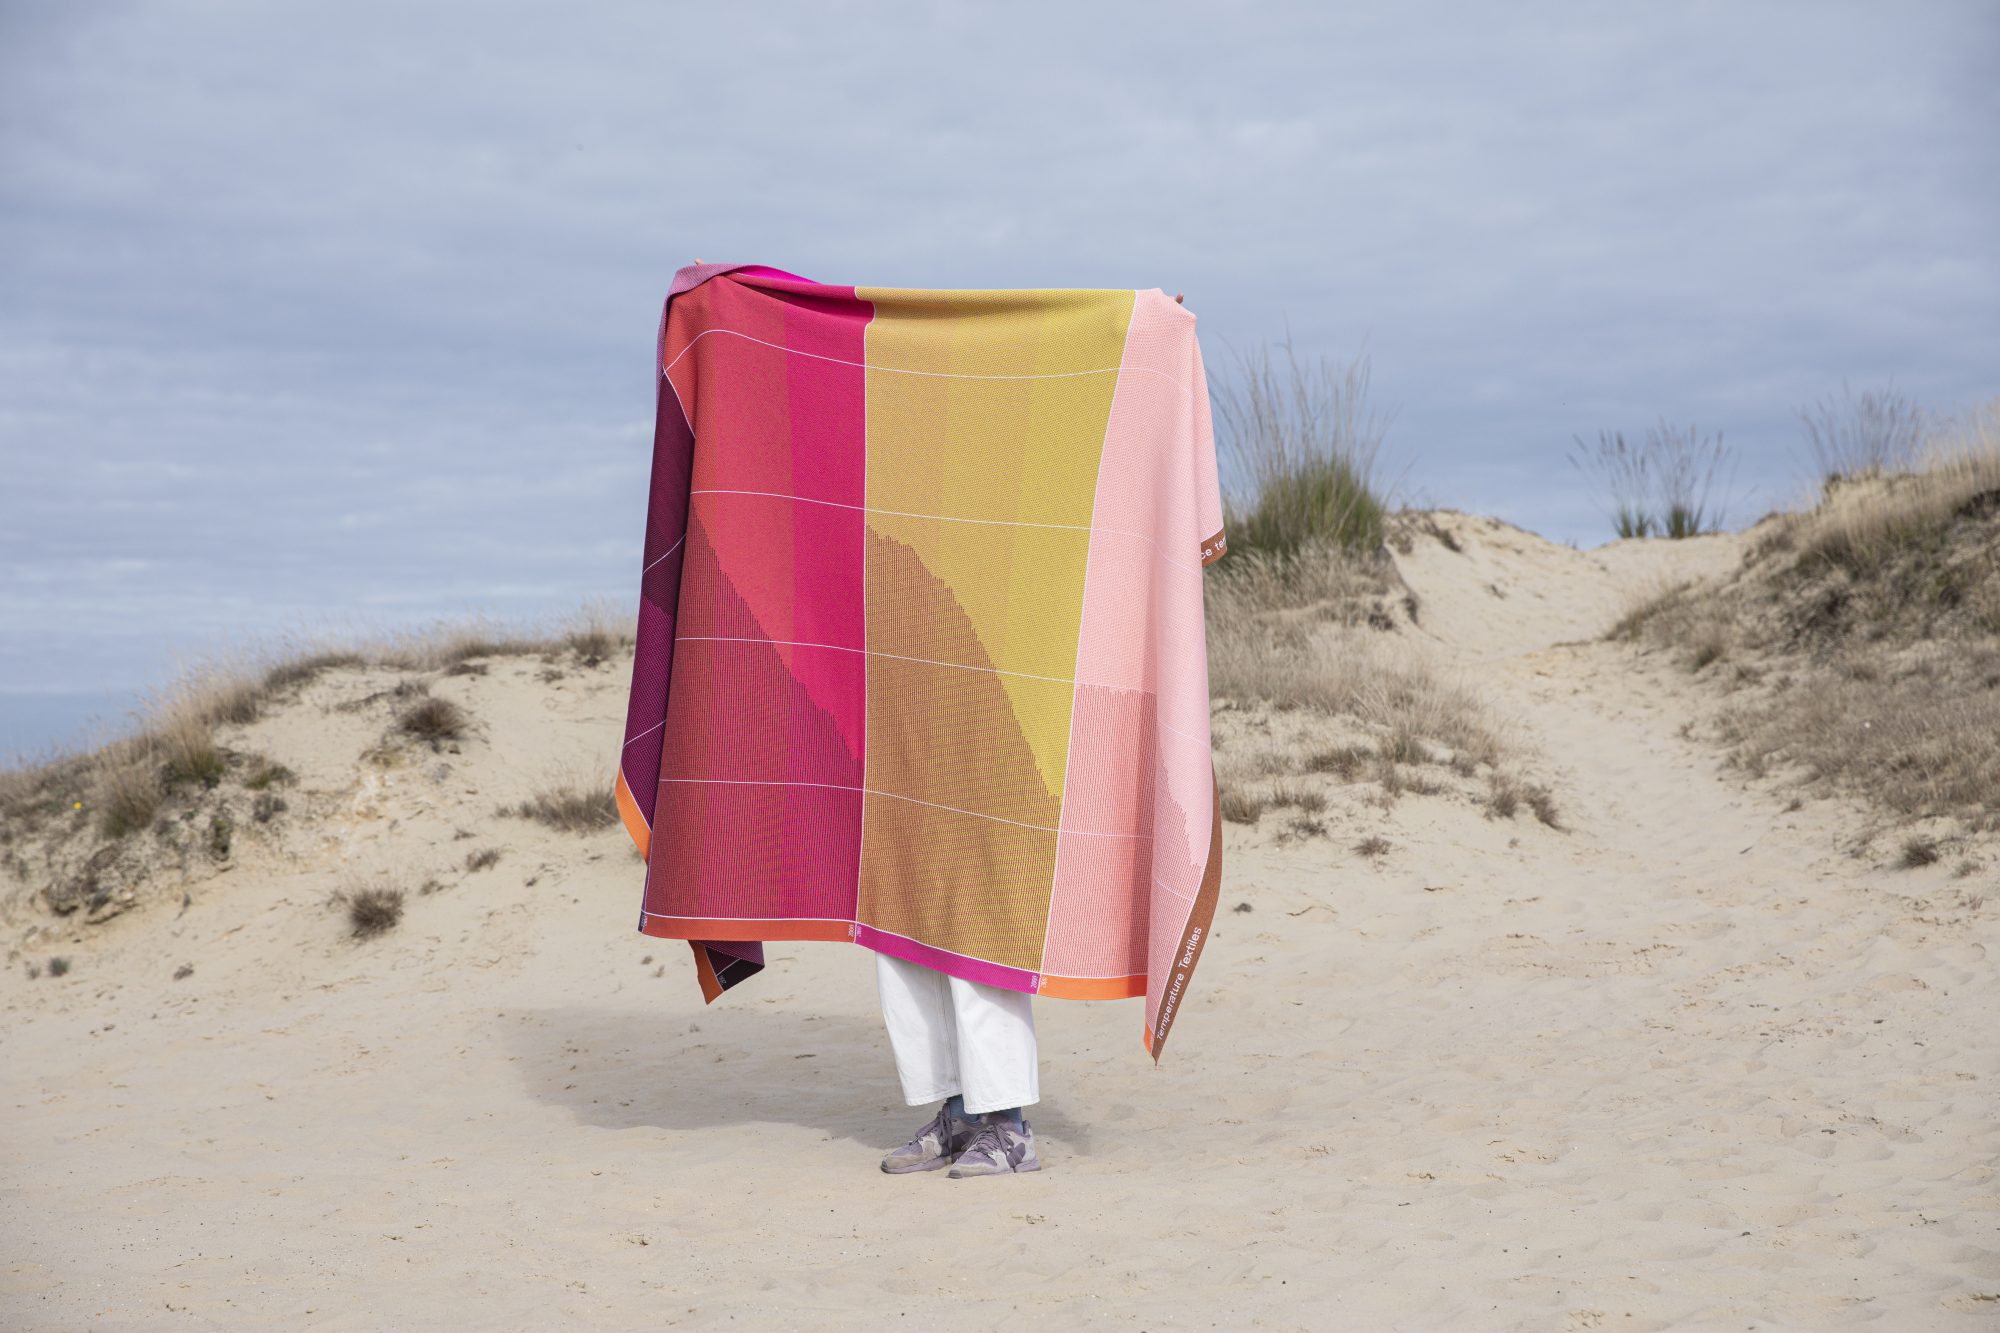

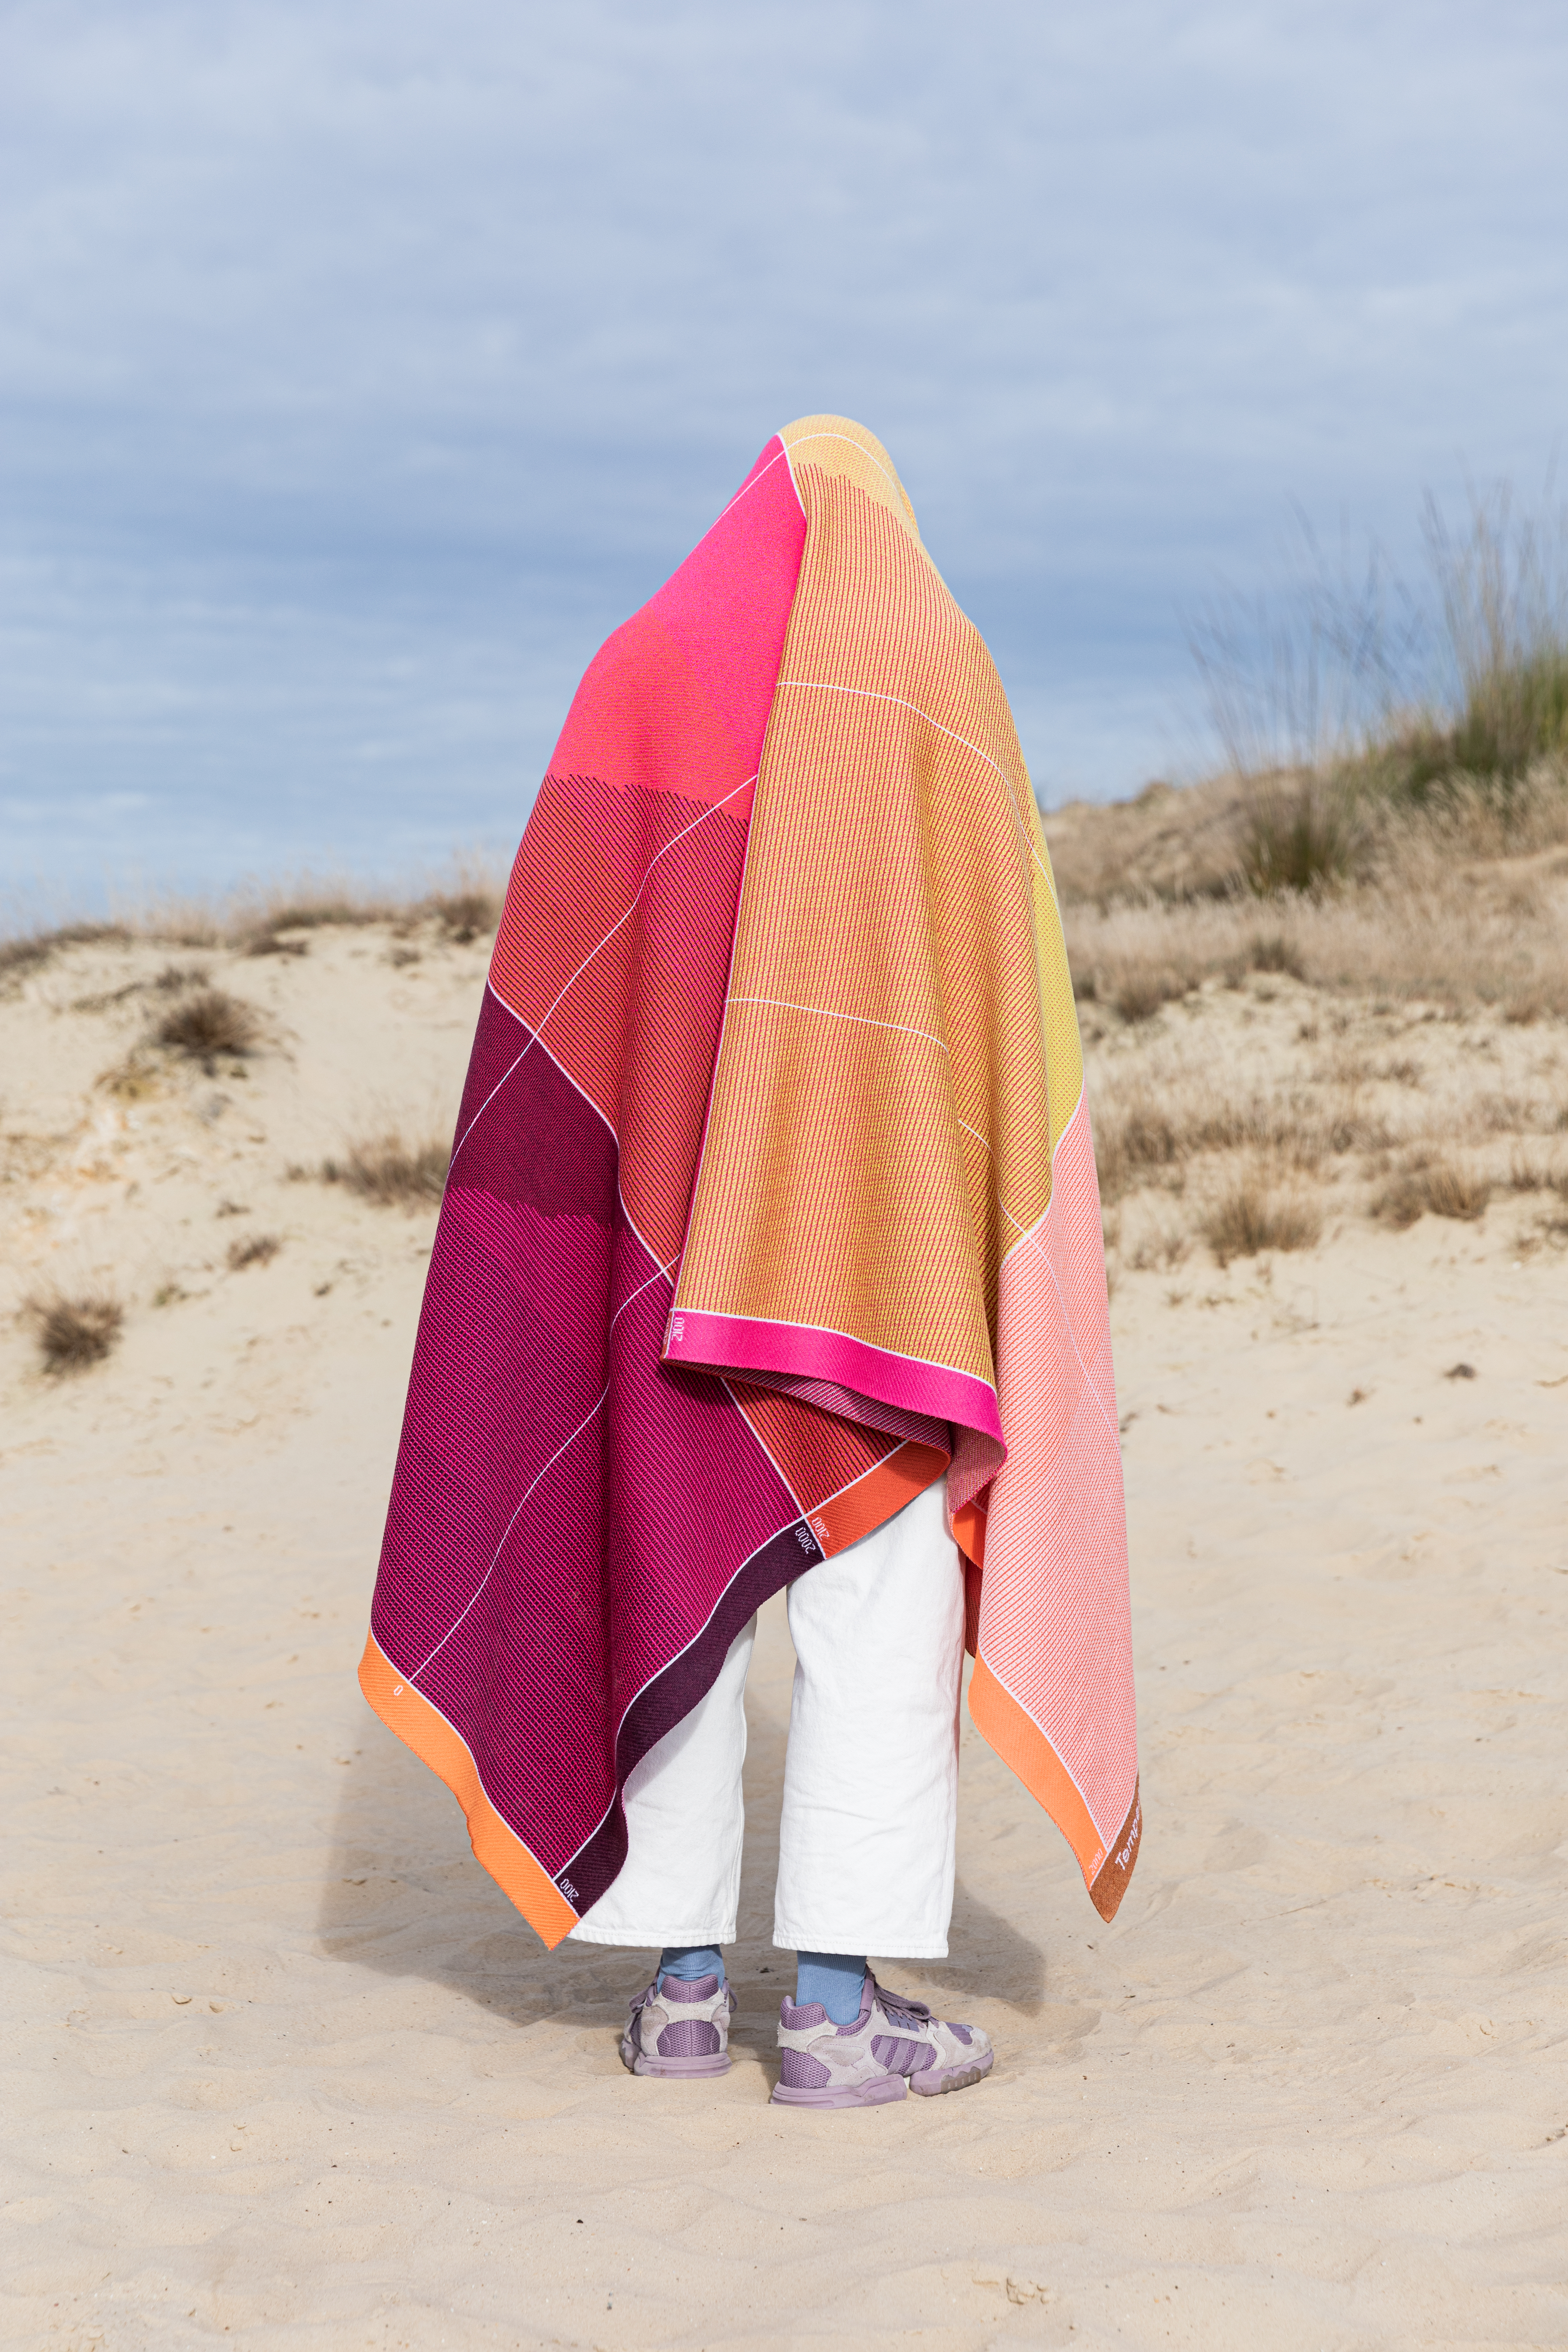
The pattern of the blanket is based on the 4 different scenario predictions that have been modelled by IPCC. The lines show the recorded temperature rise from 2000 until the predicted rise in 2100.
The records prove that temperature has been noticeably going up since industrialisation. According to scientific research an average rise of more than 1ºC has been reached.
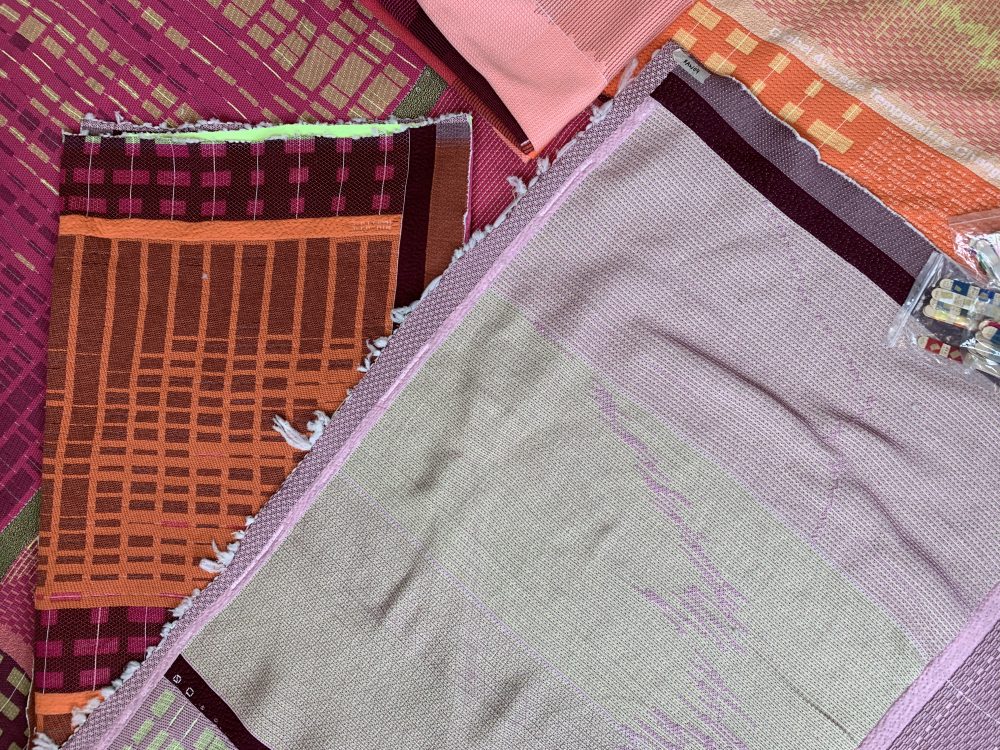
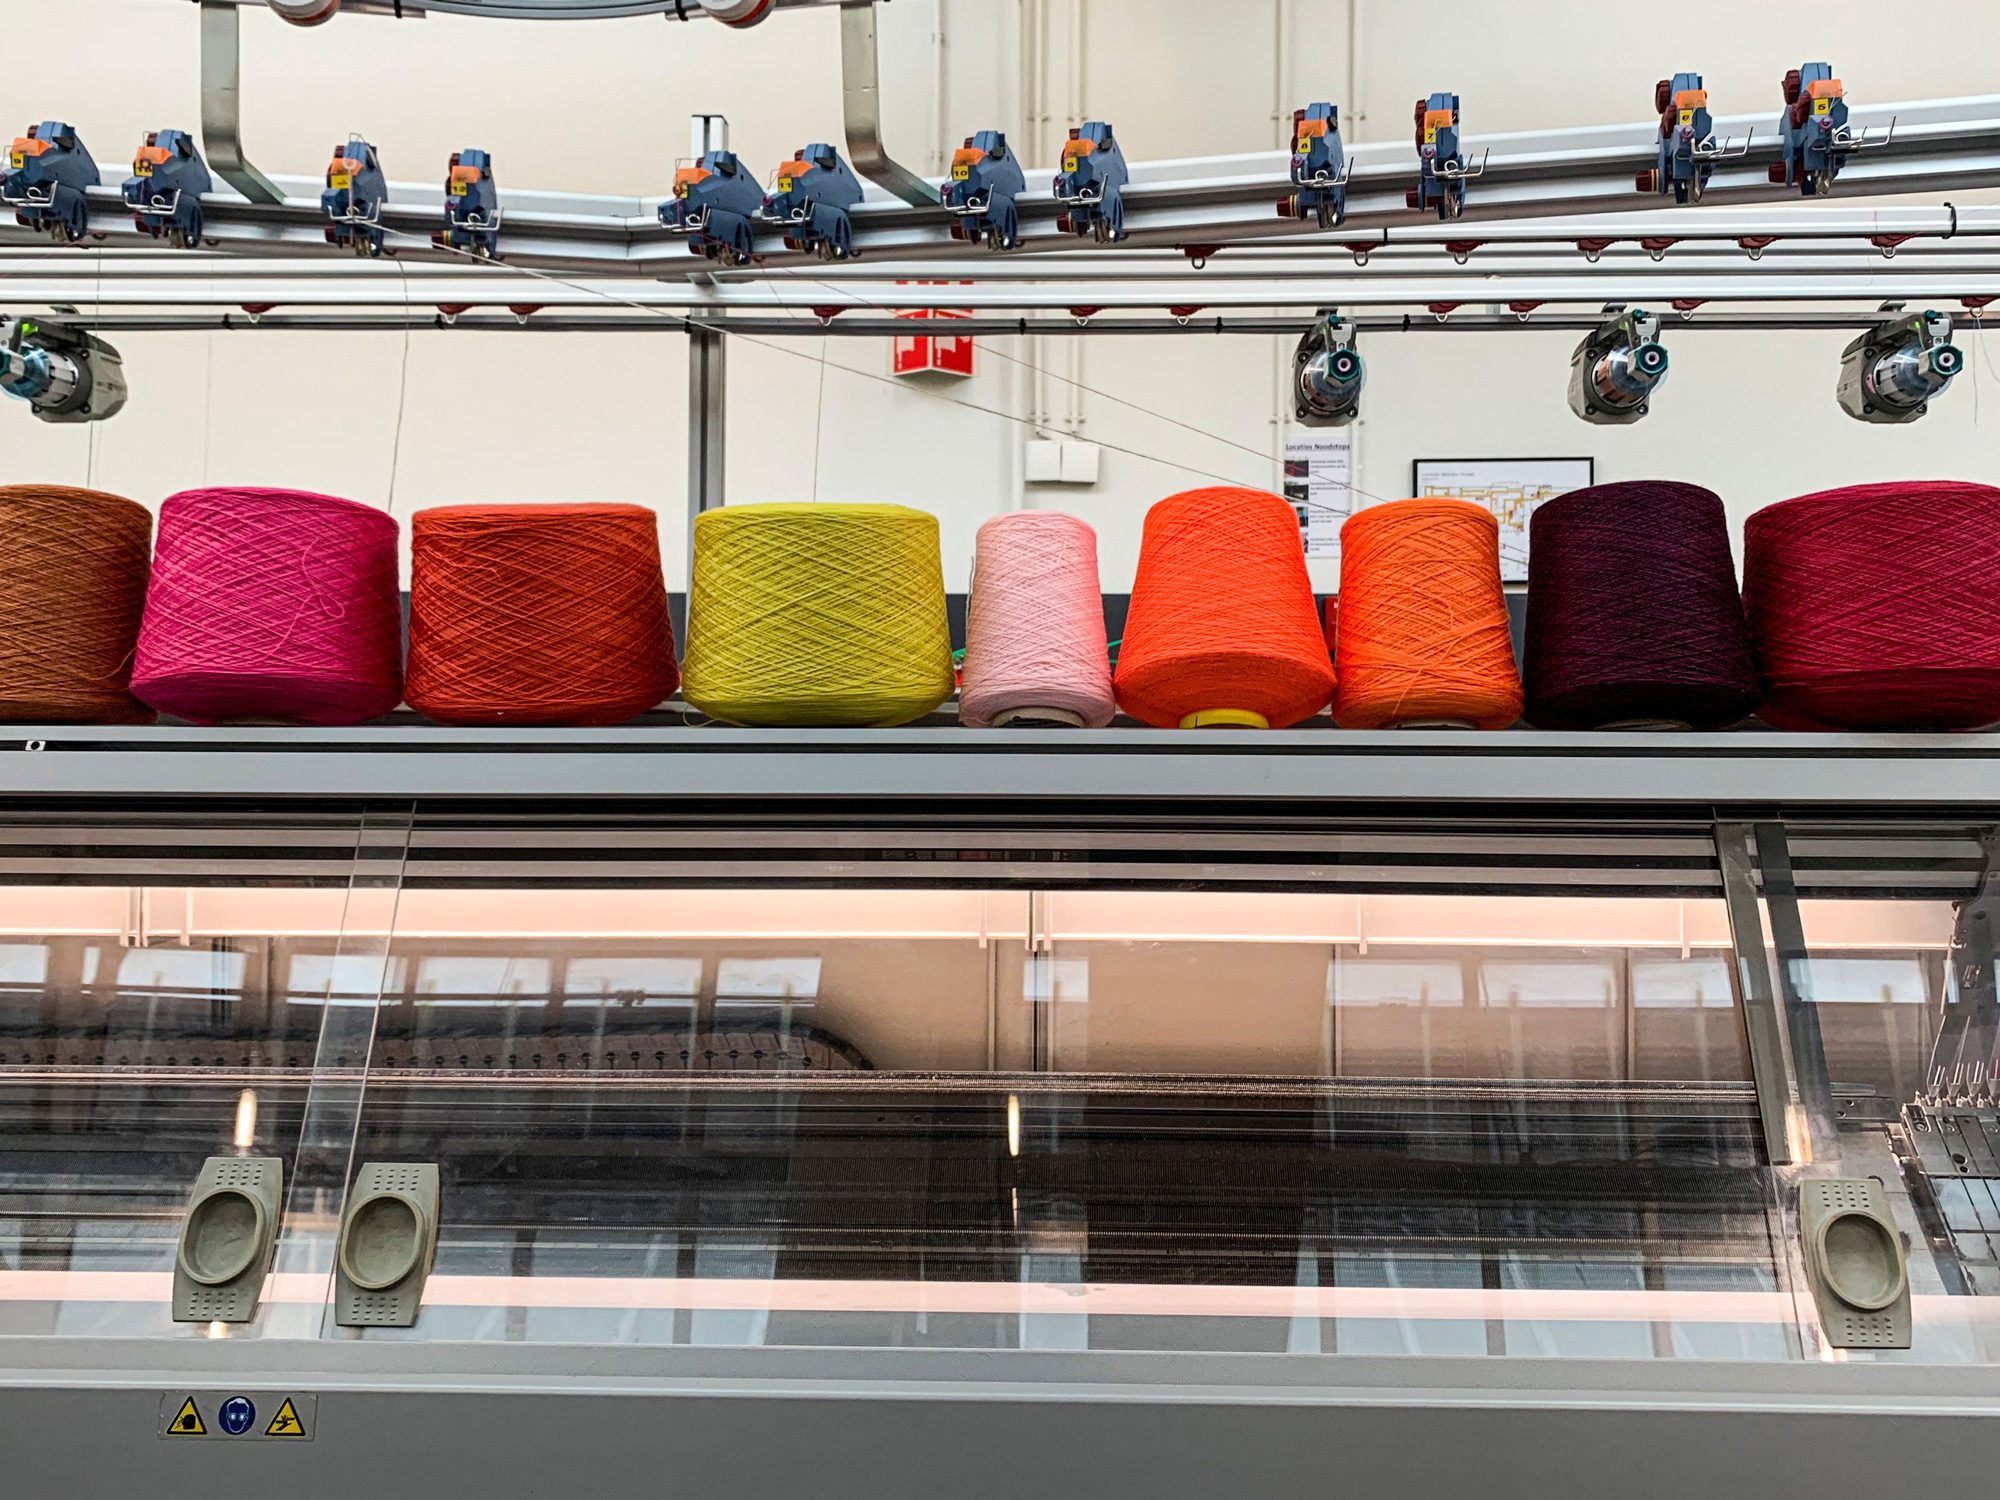
Flat-bed knitting machines are traditionally used for the production of pullovers and other outerwear garments. The technique of knitting reduces waste during the production due to its made to measure ability. For the development of the flat knit blankets the studio has worked with TextielLab.

Temperature Scarf

The vertical pink lines represent the predicted Surface Temperature Change in degrees Celsius of even years from 2000 until 2100. The orange surface indicates 0 – 4ºC.

The diagram shows that the temperature might reach 4ºC by 2100 in case of the least ideal scenario (RCP 8.5) if no emission reduction is applied, according to Paris Climate Agreement. The data is based on the climate report of IPCC (Intergovernmental Panel on Climate Change).

Extreme rainfall events will increase in intensity by 3 to 15%, depending on region, for every degree Celsius that the planet warms.
Temperature Blanket – Double knit


The diverse patterns and graphics of the blanket are based on several Temperature related data. For example it shows that Global Warming varies in intensity depending on the region, or it compares human and natural drivers of Temperature Change.

Communicating Climate Change through textiles. The blankets are aesthetic carriers of data that visualise Global Warming and they provide the user with warmth.